Code
dGpd(1.8, threshold = 1.5, scale = 0.5, shape = 0.2)[1] 1.013262Code
dGpd(1.8, threshold = 1.5, scale = 0.5, shape = 0.2, log = TRUE)[1] 0.01317507The standalone GPD functions dGpd, pGpd, qGpd, and rGpd implement the distribution of (X) above a threshold (u). For (xu), the density is
[ f(x;u,,)=(1+)^{-1/}, >0, +>0. ]
The CDF is [ F(x)=1-(1+)^{-1/}, xu, ] and the quantile is [ Q(p)=u+,p(0,1), , ] with the exponential-limit case obtained as ().
Parameter mapping (math () code): (u) threshold, () scale, () shape. Log-densities are returned when log = TRUE.
We show the CausalMixGPD kernels in pairs: bulk-only and GPD-augmented. A GPD tail above threshold \(u\) uses
\[f_{GPD}(x; u, \sigma, \xi) = \frac{1}{\sigma} \left(1 + \xi \frac{x-u}{\sigma}\right)^{-1/\xi - 1} \ \text{for } x \ge u.\]
The standalone GPD tail distribution is available via dGpd, pGpd, qGpd, and rGpd functions.
dGpd(1.8, threshold = 1.5, scale = 0.5, shape = 0.2)[1] 1.013262dGpd(1.8, threshold = 1.5, scale = 0.5, shape = 0.2, log = TRUE)[1] 0.01317507pGpd(1.8, threshold = 1.5, scale = 0.5, shape = 0.2)[1] 0.4325731pGpd(1.8, threshold = 1.5, scale = 0.5, shape = 0.2, lower.tail = FALSE)[1] 0.5674269pGpd(1.8, threshold = 1.5, scale = 0.5, shape = 0.2, log.p = TRUE)[1] -0.8380038q_vec(qGpd, c(0.25, 0.5, 0.75), threshold = 1.5, scale = 0.5, shape = 0.2)[1] 1.648060 1.871746 2.298770q_vec(qGpd, c(0.25, 0.5, 0.75), threshold = 1.5, scale = 0.5, shape = 0.2,
lower.tail = FALSE)[1] 2.298770 1.871746 1.648060q_vec(qGpd, c(log(0.25), log(0.5), log(0.75)), threshold = 1.5, scale = 0.5,
shape = 0.2, log.p = TRUE)[1] 1.648060 1.871746 2.298770draw_many(rGpd, list(threshold = 1.5, scale = 0.5, shape = 0.2))[1] 1.659149 1.743881 1.963634 3.030685 1.615199grid <- seq(-4, 15, length.out = 500)
gpd_sets <- list(
list(label = "GPD A", threshold = 1.5, tail_scale = 0.5, tail_shape = 0.2),
list(label = "GPD B", threshold = 2.0, tail_scale = 0.6, tail_shape = 0.15),
list(label = "GPD C", threshold = 1.0, tail_scale = 0.4, tail_shape = 0.25)
)
df_gpd <- do.call(rbind, lapply(gpd_sets, function(ps) {
data.frame(x = grid, density = density_curve(grid, dGpd, list(threshold = ps$threshold, scale = ps$tail_scale, shape = ps$tail_shape)), label = ps$label)
}))
ggplot(df_gpd, aes(x = x, y = density, color = label)) +
geom_line(linewidth = 1) +
labs(title = "Standalone GPD tails", x = "x", y = "density") +
theme_minimal() + theme(legend.position = "top")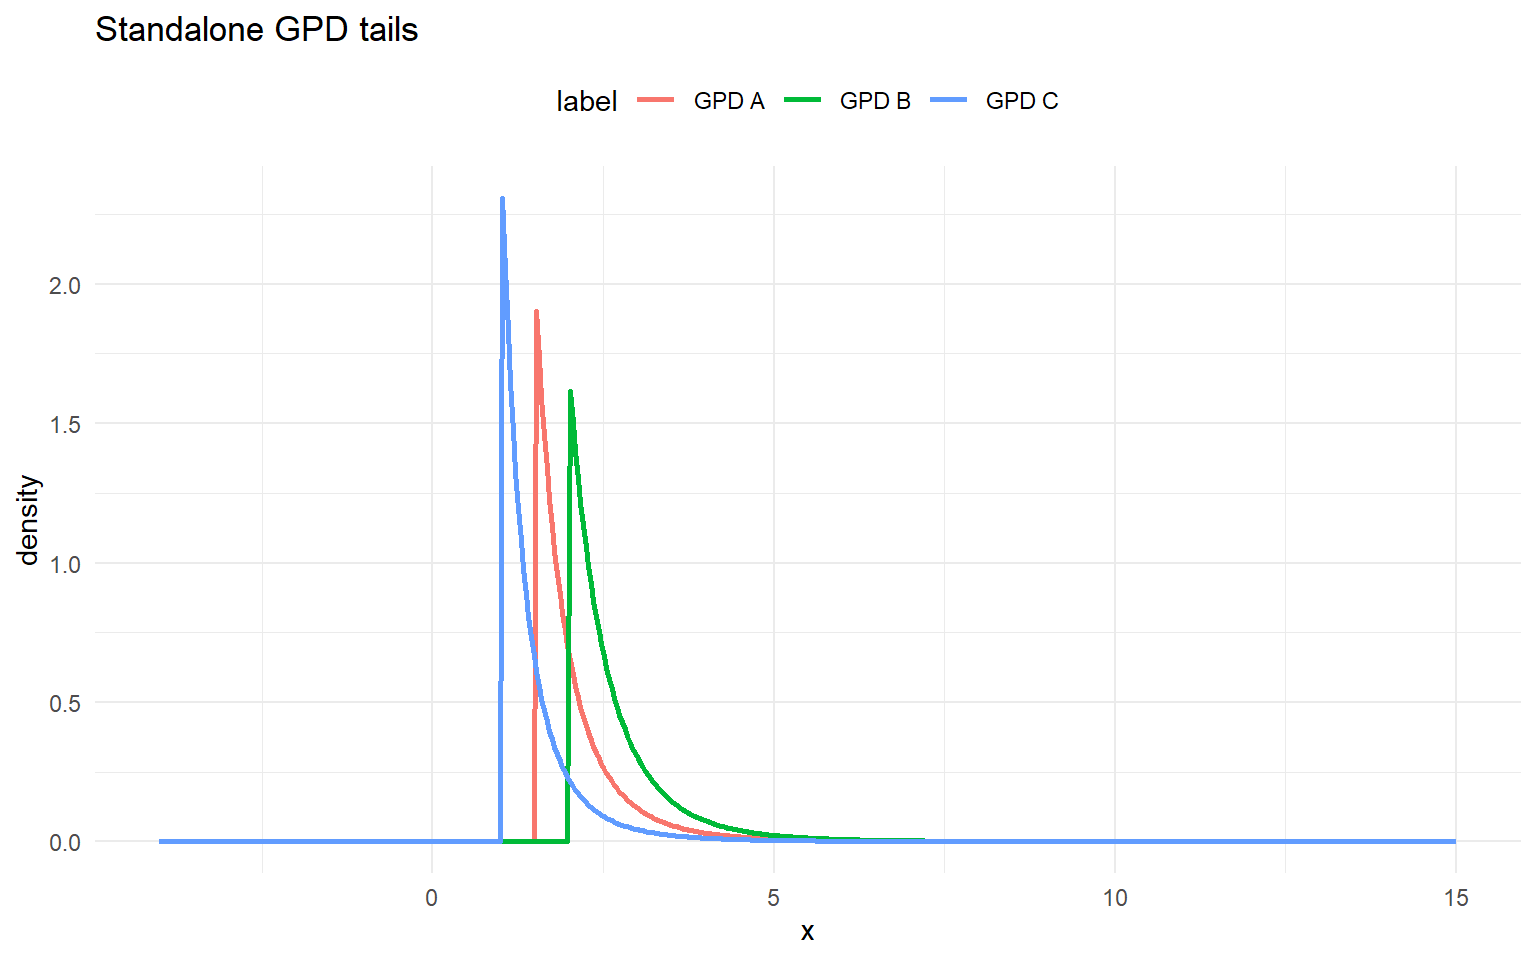
Each subsection below defines the available \(d/p/q/r\) functions, prints example outputs for fixed parameters, and overlays density curves for three parameter sets with clear legends. The same parameter sets are reused within the bulk and GPD variants of a section.