gamma_gpd_sets <- list(
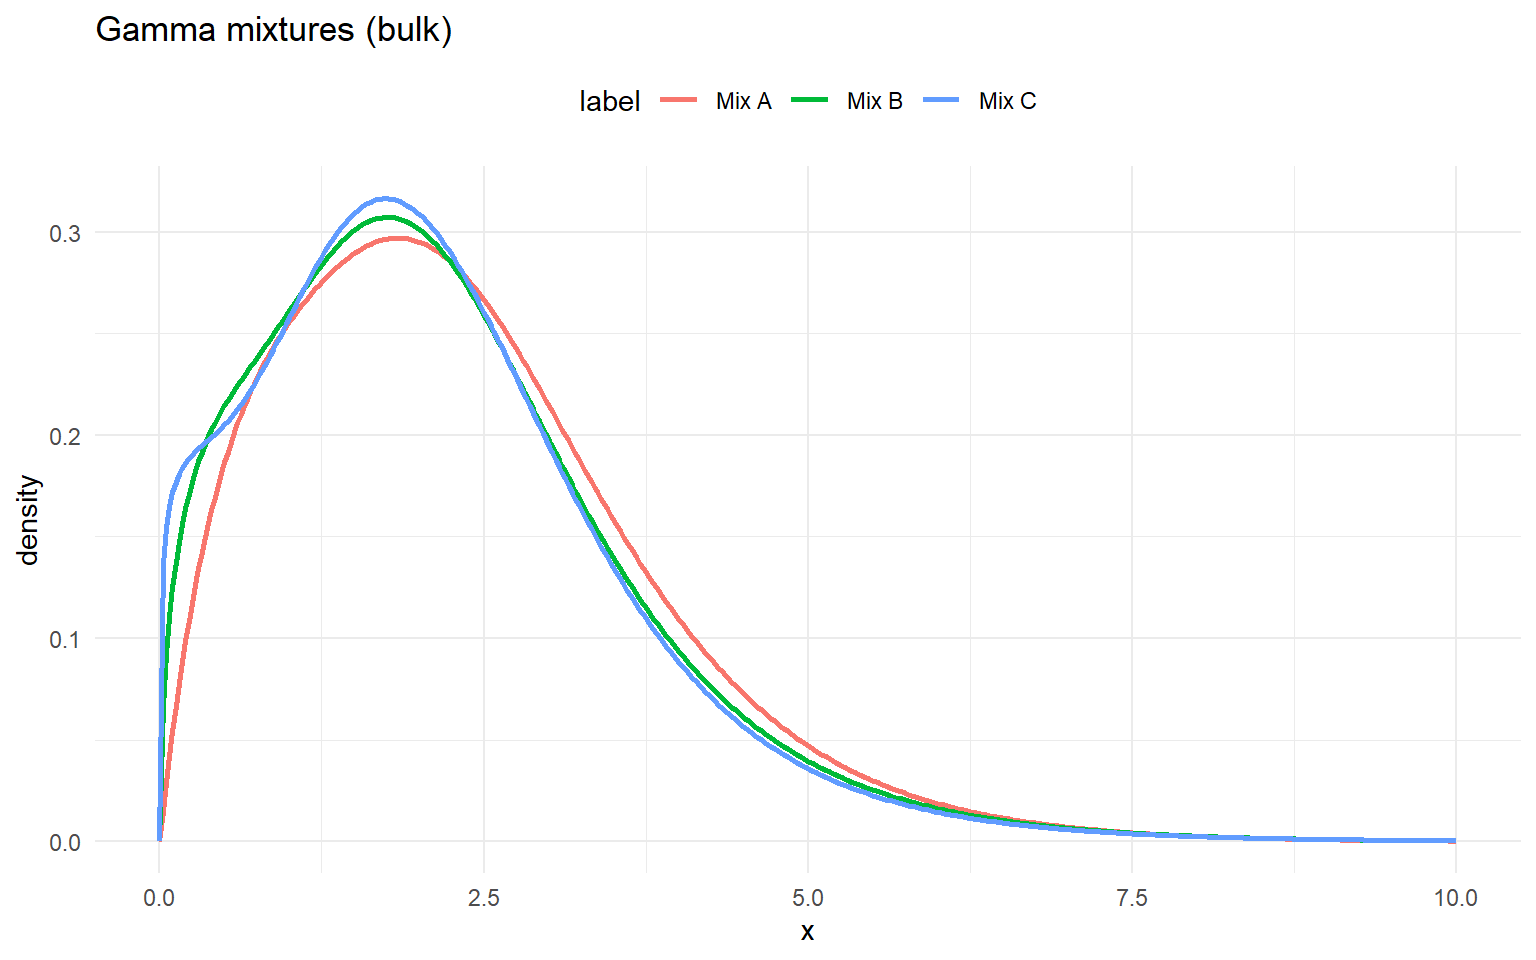
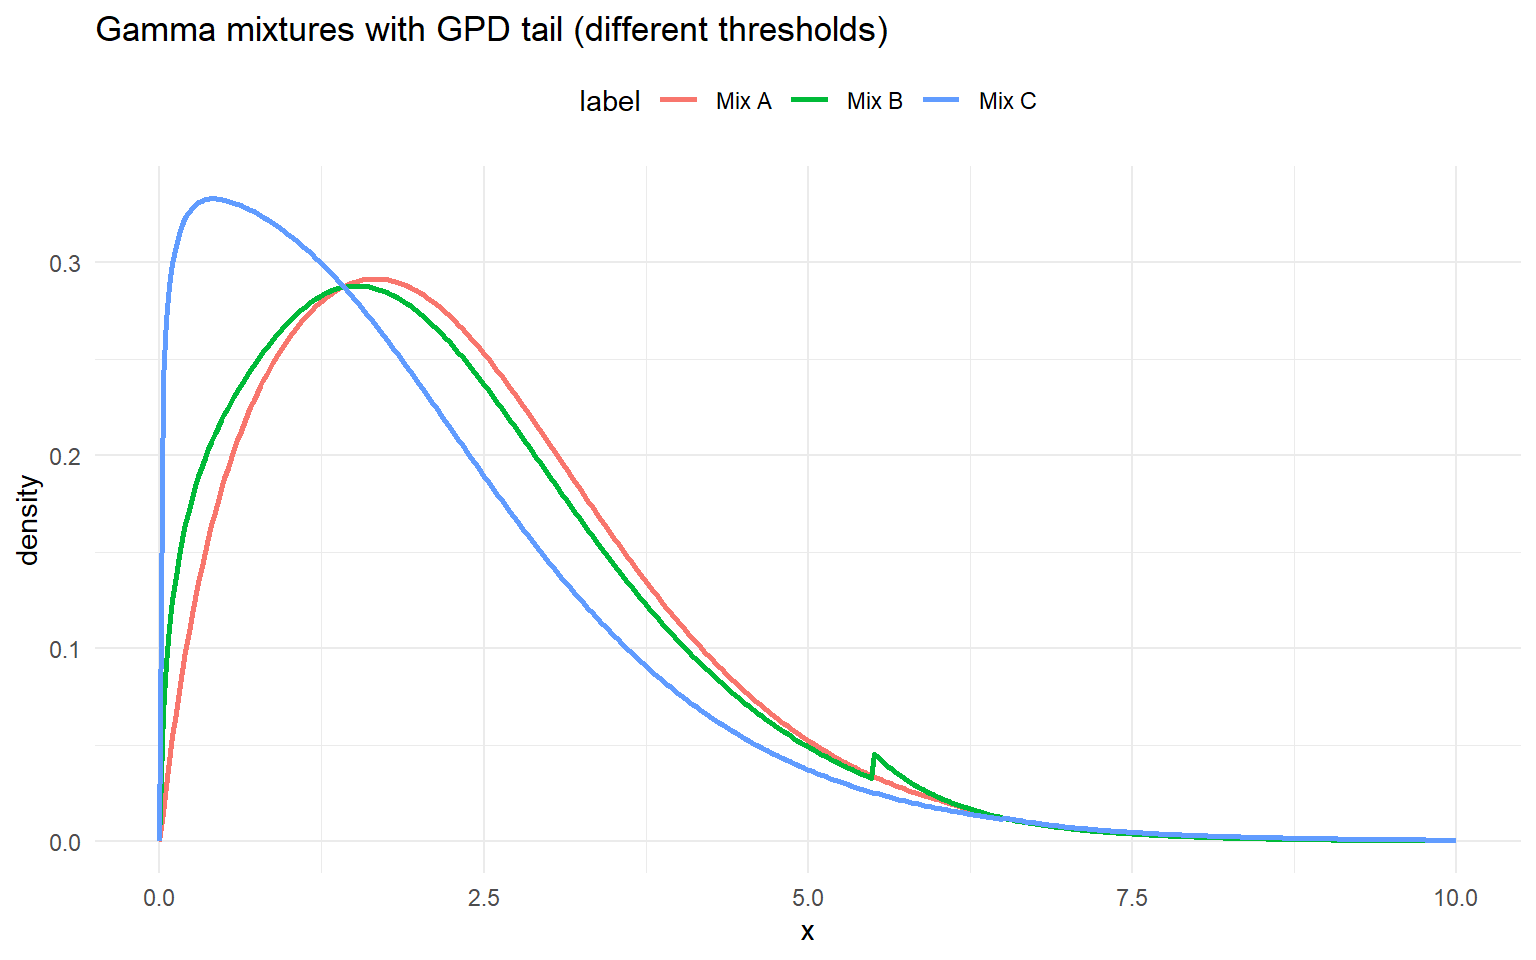
list(label = "Mix A", w = c(0.6, 0.4), shape = c(2.0, 5.0), scale = c(1.0, 0.6), threshold = 6.0, tail_scale = 1.0, tail_shape = 0.2),
list(label = "Mix B", w = c(0.5, 0.5), shape = c(1.5, 4.0), scale = c(1.2, 0.7), threshold = 5.5, tail_scale = 0.8, tail_shape = 0.15),
list(label = "Mix C", w = c(0.7, 0.3), shape = c(1.2, 3.5), scale = c(1.4, 0.75), threshold = 6.5, tail_scale = 1.2, tail_shape = 0.25)
)
df_gamma_gpd <- do.call(rbind, lapply(gamma_gpd_sets, function(ps) {
data.frame(x = grid, density = density_curve(grid, dGammaMixGpd, list(w = ps$w, shape = ps$shape, scale = ps$scale, threshold = ps$threshold, tail_scale = ps$tail_scale, tail_shape = ps$tail_shape)), label = ps$label)
}))
ggplot(df_gamma_gpd, aes(x = x, y = density, color = label)) +
geom_line(linewidth = 1) +
labs(title = "Gamma mixtures with GPD tail (different thresholds)", x = "x", y = "density") +
theme_minimal() + theme(legend.position = "top")