$fit
index estimate lower upper
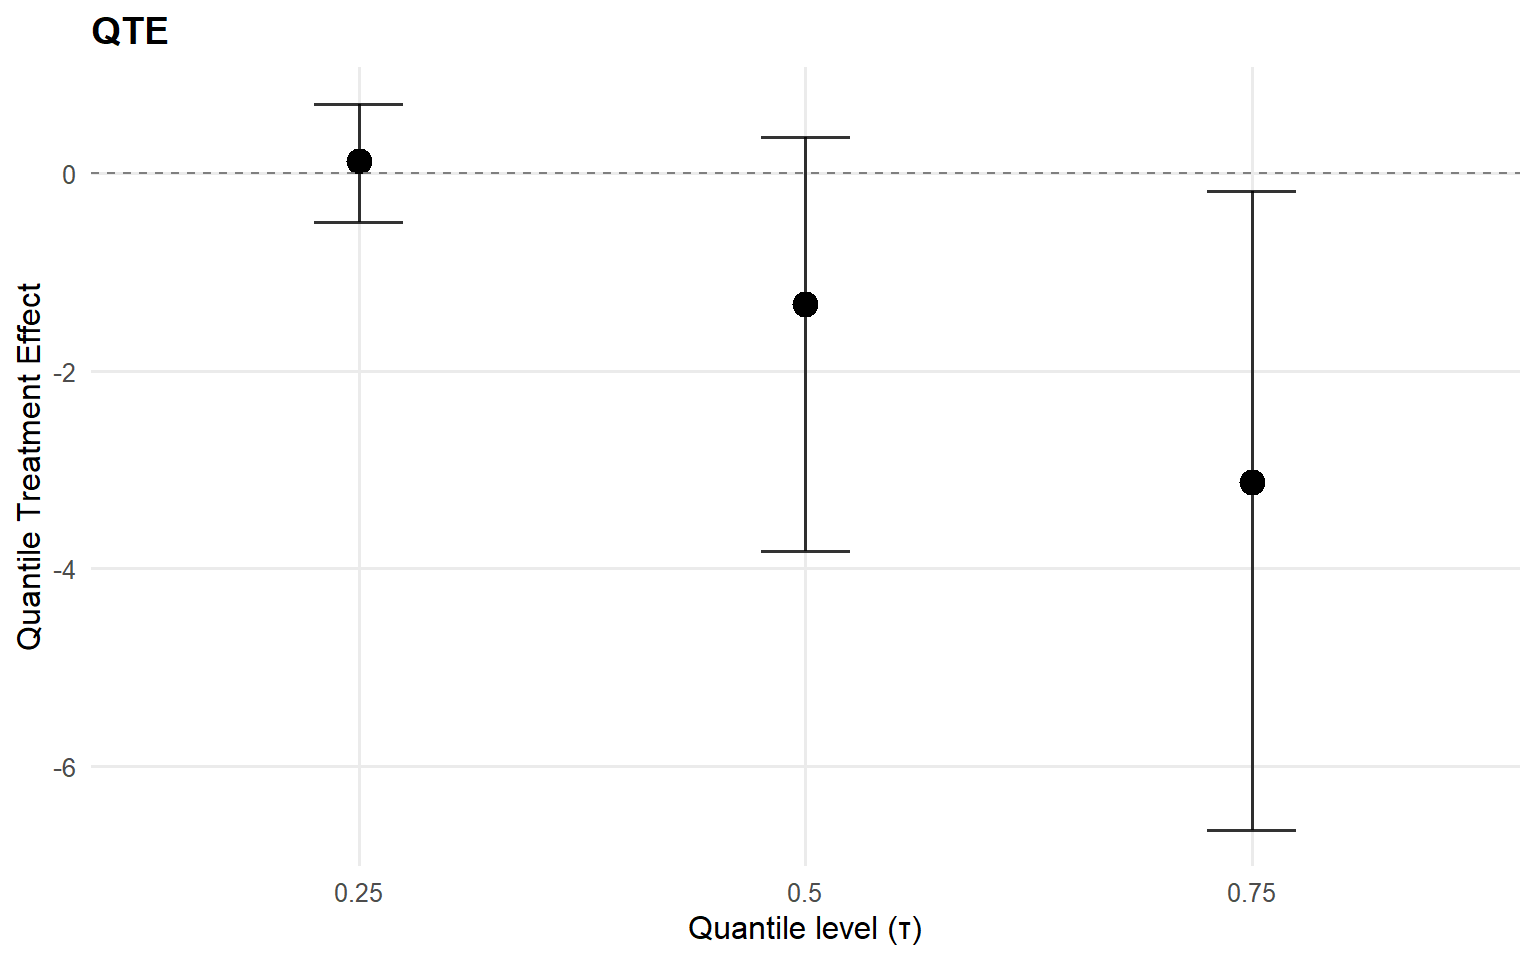
1 0.25 0.1237246 -0.4915869 0.7020959
2 0.50 -1.3286725 -3.8227786 0.3664909
3 0.75 -3.1335342 -6.6520262 -0.1865833
$fit_df
index estimate lower upper
1 0.25 0.1237246 -0.4915869 0.7020959
2 0.50 -1.3286725 -3.8227786 0.3664909
3 0.75 -3.1335342 -6.6520262 -0.1865833
$lower
[1] -0.4915869 -3.8227786 -6.6520262
$upper
[1] 0.7020959 0.3664909 -0.1865833
$qte
$qte$fit
index estimate lower upper
1 0.25 0.1237246 -0.4915869 0.7020959
2 0.50 -1.3286725 -3.8227786 0.3664909
3 0.75 -3.1335342 -6.6520262 -0.1865833
$qte$draws
, , 1
[,1]
[1,] -0.554440342
[2,] -0.283676647
[3,] -0.422117218
[4,] -0.403513209
[5,] 0.154347918
[6,] -0.227688809
[7,] 0.014147107
[8,] 0.116037621
[9,] 0.441863606
[10,] 0.425650919
[11,] 0.245309463
[12,] 0.190484236
[13,] 0.309299009
[14,] 0.106960562
[15,] 0.162885499
[16,] -0.010890040
[17,] 0.055210120
[18,] 0.394793550
[19,] 0.238412139
[20,] 0.071395424
[21,] 0.151551372
[22,] -0.059210257
[23,] 0.142218640
[24,] 0.030883629
[25,] -0.237594778
[26,] -0.058722741
[27,] 0.105488934
[28,] 0.281047030
[29,] 0.269776848
[30,] 0.503954431
[31,] -0.009014745
[32,] -0.144123948
[33,] 0.745139399
[34,] 0.631451898
[35,] -0.606326243
[36,] -0.020408155
[37,] 0.557183681
[38,] 0.689316332
[39,] 0.713658355
[40,] 0.442170507
[41,] 0.161470745
[42,] -0.111325699
[43,] 0.098583645
[44,] 0.547805054
[45,] 0.053788704
[46,] 0.447996993
[47,] 0.338753132
[48,] 0.365327916
[49,] -0.329336640
[50,] -0.331787898
[51,] 0.068591246
[52,] -0.009719949
[53,] 0.344083744
[54,] 0.460920569
[55,] 0.463370533
[56,] -0.233573426
[57,] 0.168802101
[58,] 0.110979087
[59,] -0.154603561
[60,] -0.189560409
, , 2
[,1]
[1,] -1.15602099
[2,] -0.41019833
[3,] -1.00236206
[4,] -0.90069376
[5,] -0.45965163
[6,] -0.60648672
[7,] -0.39311821
[8,] -0.56123904
[9,] 0.35920752
[10,] 0.41705720
[11,] -0.04080695
[12,] 0.04987707
[13,] 0.37308060
[14,] -0.09772410
[15,] -0.37490660
[16,] -0.48441689
[17,] -0.22872893
[18,] -0.16210743
[19,] -0.24539357
[20,] -0.33672423
[21,] -0.05552412
[22,] -0.90897300
[23,] -0.23567718
[24,] -0.50367251
[25,] -0.69586382
[26,] -0.40405655
[27,] -0.50987180
[28,] -0.19301837
[29,] -0.02227993
[30,] -0.10756470
[31,] -1.81393595
[32,] -1.56540654
[33,] -2.82632628
[34,] -3.59323379
[35,] -3.95108657
[36,] -3.60666087
[37,] -2.30070934
[38,] -1.79835821
[39,] -1.16480202
[40,] -2.51315414
[41,] -2.04712669
[42,] -2.07881464
[43,] -2.49061956
[44,] -1.91132803
[45,] -3.73903708
[46,] -2.78316720
[47,] -2.32799846
[48,] -1.95755462
[49,] -3.02134536
[50,] -2.02024135
[51,] -1.89317829
[52,] -1.80091070
[53,] -1.78060730
[54,] -0.70802810
[55,] -1.03355192
[56,] -2.98815995
[57,] -2.27462667
[58,] -1.93403772
[59,] -1.99993916
[60,] -3.89854473
, , 3
[,1]
[1,] -2.11349261
[2,] -1.04490277
[3,] -1.37413523
[4,] -1.43372491
[5,] -0.84041626
[6,] -1.79037015
[7,] -1.21694441
[8,] -1.48715741
[9,] -0.51140852
[10,] -0.14250159
[11,] -0.56501757
[12,] 0.06819229
[13,] -0.50004158
[14,] -0.23530515
[15,] -1.13192376
[16,] -1.30208212
[17,] -1.04714650
[18,] -1.28850336
[19,] -0.71735077
[20,] -1.14603004
[21,] -0.99715893
[22,] -1.56019207
[23,] -1.27297967
[24,] -0.96151552
[25,] -1.52375089
[26,] -1.38495650
[27,] -1.10740700
[28,] -1.43385790
[29,] -0.74325187
[30,] -2.03955493
[31,] -4.17212198
[32,] -4.28522618
[33,] -6.32852063
[34,] -5.83118155
[35,] -6.61931320
[36,] -6.18878378
[37,] -5.61821155
[38,] -4.81992001
[39,] -3.83957352
[40,] -4.37818937
[41,] -4.05853495
[42,] -3.98372112
[43,] -4.66046975
[44,] -4.26676156
[45,] -5.99307558
[46,] -5.17776961
[47,] -4.75262880
[48,] -4.14913790
[49,] -4.79450853
[50,] -4.76703628
[51,] -4.17410840
[52,] -4.68832460
[53,] -5.71892922
[54,] -5.05642458
[55,] -5.61008220
[56,] -7.46008386
[57,] -6.66637939
[58,] -4.86752269
[59,] -5.60446250
[60,] -6.63616220
$probs
[1] 0.25 0.50 0.75