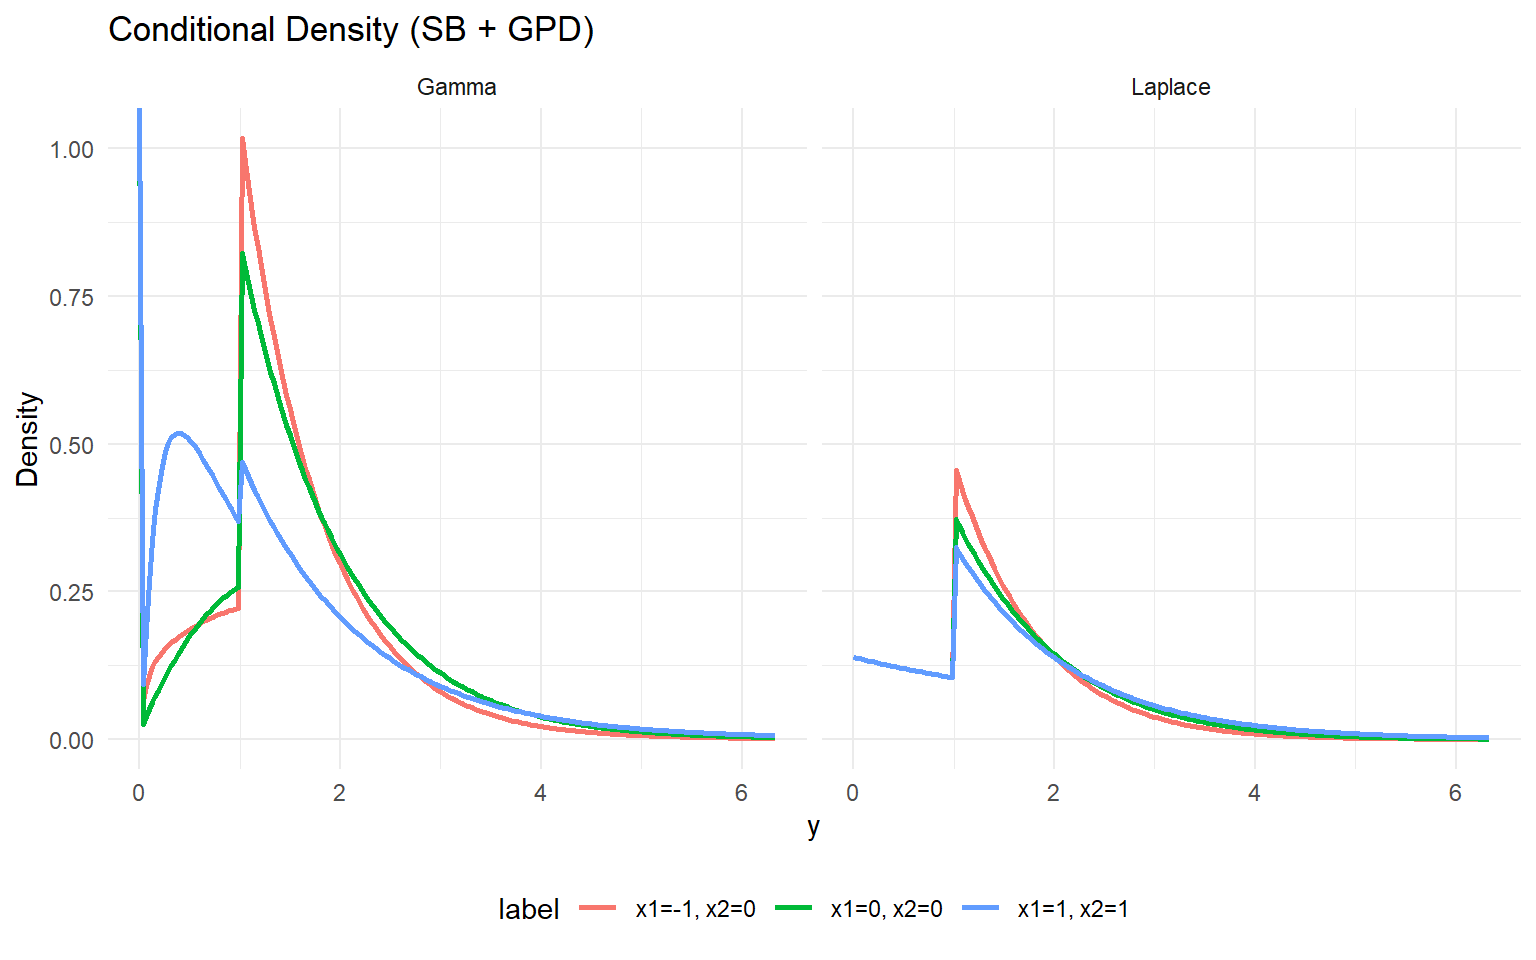
CausalMixGPD
  • Home
  • Roadmaps
    • Website roadmap
    • Package roadmap
  • Start
    • Start Hub
    • Roadmap
    • Usage Diagrams
    • Start Here
    • Basic Compile and Run
    • Backends and Workflow
    • Troubleshooting
  • Tracks
    • Quickstart
    • Modeling (1-arm)
    • Causal
    • Clustering
    • Kernels & tails
    • Customization
  • Examples
  • Kernels
  • Advanced
  • Developers
  • Reference
    • Reference hub
    • Function reference by job
  • News
  • Cite
  • Coverage
  • API Reference

ex08. Conditional DPMGPD (SB Backend)

Website workflow note. This page reflects the current exported API and recommended wrapper-first usage. Last updated: 2026-02-19.

For the full package narrative, see the main package vignettes (basic, unconditional, conditional, and causal).

Conditional CausalMixGPD: Stick-Breaking Backend

Purpose: Apply fixed-component stick-breaking truncation to covariate-dependent mixtures while keeping the GPD tail. This vignette mirrors ex10 but with the SB backend.

What you’ll learn

  • How to combine conditional modeling (y X) with SB truncation and GPD tail augmentation.
  • How to keep the workflow wrapper-first: bundle() → dpmgpd() → predict()/plot().
  • How to compare bulk kernels under the same SB+GPD structure to diagnose bulk vs tail sensitivity.

When to use this template

  • You need tail-aware conditional predictions but want fixed-complexity mixtures for iteration and tuning.
  • You prefer choosing an explicit upper bound (components) over CRP-style partition flexibility.

Next steps

  • Try the CRP conditional tail version (ex07) to compare conditional tail uncertainty under a different backend.

Data Setup

Code
data("nc_posX100_p5_k4")
y <- nc_posX100_p5_k4$y
X <- as.matrix(nc_posX100_p5_k4$X)
if (is.null(colnames(X))) {
  colnames(X) <- paste0("x", seq_len(ncol(X)))
}

summary_tbl <- tibble(
  statistic = c("N", "Mean", "SD", "Min", "Max"),
  value = c(length(y), mean(y), sd(y), min(y), max(y))
)

ggplot(data.frame(y = y, x1 = X[, 1]), aes(x = x1, y = y)) +
  geom_point(alpha = 0.6, color = "purple") +
  geom_smooth(method = "loess", color = "orange", fill = NA) +
  labs(title = "Tail Outcome vs x1 (SB)", x = "x1", y = "y") +
  theme_minimal()

Code
summary_tbl
# A tibble: 5 × 2
  statistic   value
  <chr>       <dbl>
1 N         100    
2 Mean        1.94 
3 SD          1.15 
4 Min         0.488
5 Max         5.28 

Threshold

Code
u_threshold <- quantile(y, 0.85)

ggplot(data.frame(y = y), aes(x = y)) +
  geom_histogram(aes(y = after_stat(density)), bins = 40, fill = "lightgreen", alpha = 0.6, color = "black") +
  geom_vline(xintercept = u_threshold, linetype = "dashed", color = "black") +
  labs(title = "Threshold for SB tail (85%)", x = "y", y = "Density") +
  theme_minimal()


Model Specification

Code
bundle_sb_cond_gpd_gamma <- bundle(
  y = y,
  X = X,
  kernel = "gamma",
  backend = "sb",
  GPD = TRUE,
  components = 5,
  param_specs = list(
    gpd = list(
      threshold = list(mode = "link", link = "exp")
    )
  ),
  mcmc = mcmc
)

bundle_sb_cond_gpd_laplace <- bundle(
  y = y,
  X = X,
  kernel = "laplace",
  backend = "sb",
  GPD = TRUE,
  components = 5,
  param_specs = list(
    gpd = list(
      threshold = list(mode = "link", link = "exp")
    )
  ),
  mcmc = mcmc
)

MCMC Execution

Code
fit_sb_cond_gpd_gamma <- load_or_fit("ex08-conditional-dpmgpd-sb-fit_sb_cond_gpd_gamma", dpmgpd(bundle_sb_cond_gpd_gamma))
fit_sb_cond_gpd_laplace <- load_or_fit("ex08-conditional-dpmgpd-sb-fit_sb_cond_gpd_laplace", dpmgpd(bundle_sb_cond_gpd_laplace))
summary(fit_sb_cond_gpd_gamma)
MixGPD summary | backend: Stick-Breaking Process | kernel: Gamma Distribution | GPD tail: TRUE | epsilon: 0.025
n = 100 | components = 5
Summary
Initial components: 5 | Components after truncation: 2

Summary table
          parameter   mean    sd q0.025 q0.500 q0.975     ess
         weights[1]  0.601 0.145  0.423  0.553  0.861   3.424
         weights[2]  0.257 0.085  0.138  0.231  0.464   7.234
              alpha  0.857 0.624  0.151  0.609  2.268   2.048
   beta_scale[1, 1] -0.224 0.261 -0.772 -0.238  0.245   25.65
   beta_scale[2, 1]   0.22 0.818 -1.449  0.193  1.989  32.749
   beta_scale[3, 1] -0.205 1.698 -3.295 -0.162  4.516  93.175
   beta_scale[4, 1]  0.161 1.785 -3.108  0.126  3.773  80.657
   beta_scale[5, 1]  0.083 1.951 -3.706  0.236  3.405 110.762
   beta_scale[1, 2]  -0.47  0.57 -1.735 -0.417  0.568  28.862
   beta_scale[2, 2] -0.044 1.147 -1.867 -0.029  2.635  14.745
   beta_scale[3, 2] -0.005 1.693 -2.995 -0.182  3.654  45.849
   beta_scale[4, 2]  0.142 1.755 -3.189  0.019  4.323 105.242
   beta_scale[5, 2]  0.087 1.755 -3.362  0.022  3.388  57.353
   beta_scale[1, 3]  0.208 0.295 -0.304  0.181  0.854  62.894
   beta_scale[2, 3] -0.131 0.708 -1.764 -0.095  1.272  56.406
   beta_scale[3, 3] -0.103 1.785 -3.561  0.041  2.934 137.278
   beta_scale[4, 3] -0.152 1.699 -3.538 -0.181  3.282  74.715
   beta_scale[5, 3] -0.232 1.823 -4.179  0.007  3.244     150
   beta_scale[1, 4]  0.296 1.131 -1.155 -0.032  2.993  15.652
   beta_scale[2, 4]  0.684 1.605 -1.598  0.449  4.042  25.515
   beta_scale[3, 4]  0.828 1.935 -3.011  0.952  4.157  71.315
   beta_scale[4, 4]  0.491 2.094 -3.392  0.672  3.956  48.517
   beta_scale[5, 4]  0.257 1.827 -3.322  0.203  3.814 107.576
   beta_scale[1, 5]  0.052 0.225 -0.277  0.033  0.458  43.619
   beta_scale[2, 5]  0.449 0.775 -0.951  0.338  1.995   39.47
   beta_scale[3, 5]  0.055 1.565 -3.013  0.023  3.103  31.064
   beta_scale[4, 5]  0.463 1.734 -3.063  0.192  3.629  77.519
   beta_scale[5, 5]  0.522 1.862 -3.639  0.501   3.76     150
 beta_tail_scale[1]  0.224  0.13 -0.023  0.224  0.493     150
 beta_tail_scale[2]   0.01 0.203 -0.361  0.001  0.386 112.961
 beta_tail_scale[3] -0.031 0.093 -0.237 -0.028  0.112     150
 beta_tail_scale[4]  0.489  0.24 -0.025  0.517  0.896  53.679
 beta_tail_scale[5] -0.049 0.094 -0.245 -0.053  0.129 116.138
  beta_threshold[1]      0     0      0      0      0       0
  beta_threshold[2]      0     0      0      0      0       0
  beta_threshold[3]      0     0      0      0      0       0
  beta_threshold[4]      0     0      0      0      0       0
  beta_threshold[5]      0     0      0      0      0       0
         tail_shape -0.024 0.115 -0.217 -0.039  0.255  27.235
           shape[1]  2.481 0.475  1.363  2.454  3.352  14.946
           shape[2]  2.989 1.189  1.273  2.714  6.179  13.375
Code
summary(fit_sb_cond_gpd_laplace)
MixGPD summary | backend: Stick-Breaking Process | kernel: Laplace Distribution | GPD tail: TRUE | epsilon: 0.025
n = 100 | components = 5
Summary
Initial components: 5 | Components after truncation: 1

Summary table
           parameter   mean    sd q0.025 q0.500 q0.975    ess
          weights[1]  0.834 0.115  0.588  0.852      1  3.525
               alpha  0.775 0.368   0.24  0.718  1.648 31.211
 beta_location[1, 1]      0     0      0      0      0      0
 beta_location[2, 1]      0     0      0      0      0      0
 beta_location[3, 1]      0     0      0      0      0      0
 beta_location[4, 1]      0     0      0      0      0      0
 beta_location[5, 1]      0     0      0      0      0      0
 beta_location[1, 2]      0     0      0      0      0      0
 beta_location[2, 2]      0     0      0      0      0      0
 beta_location[3, 2]      0     0      0      0      0      0
 beta_location[4, 2]      0     0      0      0      0      0
 beta_location[5, 2]      0     0      0      0      0      0
 beta_location[1, 3]      0     0      0      0      0      0
 beta_location[2, 3]      0     0      0      0      0      0
 beta_location[3, 3]      0     0      0      0      0      0
 beta_location[4, 3]      0     0      0      0      0      0
 beta_location[5, 3]      0     0      0      0      0      0
 beta_location[1, 4]      0     0      0      0      0      0
 beta_location[2, 4]      0     0      0      0      0      0
 beta_location[3, 4]      0     0      0      0      0      0
 beta_location[4, 4]      0     0      0      0      0      0
 beta_location[5, 4]      0     0      0      0      0      0
 beta_location[1, 5]      0     0      0      0      0      0
 beta_location[2, 5]      0     0      0      0      0      0
 beta_location[3, 5]      0     0      0      0      0      0
 beta_location[4, 5]      0     0      0      0      0      0
 beta_location[5, 5]      0     0      0      0      0      0
  beta_tail_scale[1]  0.197  0.12  -0.07    0.2   0.39    150
  beta_tail_scale[2] -0.027   0.2 -0.379 -0.038  0.385    150
  beta_tail_scale[3] -0.018 0.098 -0.221 -0.024  0.161    150
  beta_tail_scale[4]  0.541 0.236  0.131  0.552  0.979 80.822
  beta_tail_scale[5] -0.038 0.091 -0.206  -0.04  0.142    150
   beta_threshold[1]      0     0      0      0      0      0
   beta_threshold[2]      0     0      0      0      0      0
   beta_threshold[3]      0     0      0      0      0      0
   beta_threshold[4]      0     0      0      0      0      0
   beta_threshold[5]      0     0      0      0      0      0
          tail_shape -0.064 0.083 -0.158 -0.101  0.119 57.819
            scale[1]  3.765 0.834  2.403   3.67  5.639    150
Code
params_sb_cond <- params(fit_sb_cond_gpd_gamma)
params_sb_cond
Posterior mean parameters

$alpha
[1] 0.8566

$w
[1] 0.6009 0.2565

$shape
[1] 2.481 2.989

$beta_scale
            x1        x2      x3     x4      x5
comp1 -0.22420 -0.470200  0.2079 0.2959 0.05209
comp2  0.22010 -0.044060 -0.1314 0.6836 0.44910
comp3 -0.20500 -0.005438 -0.1027 0.8280 0.05459
comp4  0.16110  0.142200 -0.1518 0.4909 0.46330
comp5  0.08309  0.087220 -0.2323 0.2569 0.52210

$beta_threshold
[1] 0 0 0 0 0

$beta_tail_scale
[1]  0.223800  0.009858 -0.031200  0.488500 -0.049220

$tail_shape
[1] -0.02435

Conditional Predictions

Code
X_new <- rbind(
  c(-1, 0, 0, 0, 0),
  c(0, 0, 0, 0, 0),
  c(1, 1, 0, 0, 0)
)
colnames(X_new) <- colnames(X)
y_grid <- seq(0, max(y) * 1.2, length.out = 200)

df_pred_gamma <- lapply(seq_len(nrow(X_new)), function(i) {
  pred <- predict(fit_sb_cond_gpd_gamma, newdata =as.matrix(X_new[i, , drop = FALSE]), y = y_grid, type = "density")
  data.frame(
    y = pred$fit$y,
    density = pred$fit$density,
    label = paste("x1=", X_new[i, 1], ", x2=", X_new[i, 2], sep = ""),
    model = "Gamma"
  )
})

df_pred_laplace <- lapply(seq_len(nrow(X_new)), function(i) {
  pred <- predict(fit_sb_cond_gpd_laplace, newdata =as.matrix(X_new[i, , drop = FALSE]), y = y_grid, type = "density")
  data.frame(
    y = pred$fit$y,
    density = pred$fit$density,
    label = paste("x1=", X_new[i, 1], ", x2=", X_new[i, 2], sep = ""),
    model = "Laplace"
  )
})

bind_rows(df_pred_gamma, df_pred_laplace) %>%
  ggplot(aes(x = y, y = density, color = label)) +
  geom_line(linewidth = 1) +
  facet_wrap(~ model) +
  labs(title = "Conditional Density (SB + GPD)", x = "y", y = "Density") +
  theme_minimal() +
  theme(legend.position = "bottom")


Tail Quantiles

Code
X_grid <- cbind(x1 = seq(-1, 1, length.out = 5), x2 = 0, x3 = 0, x4 = 0, x5 = 0)
colnames(X_grid) <- colnames(X)
quant_probs <- c(0.90, 0.95)

pred_q_gamma <- predict(fit_sb_cond_gpd_gamma, newdata =as.matrix(X_grid), type = "quantile", p = quant_probs)
pred_q_laplace <- predict(fit_sb_cond_gpd_laplace, newdata =as.matrix(X_grid), type = "quantile", p = quant_probs)

quant_df_gamma <- pred_q_gamma$fit
quant_df_gamma$x1 <- X_grid[quant_df_gamma$id, "x1"]
quant_df_gamma$model <- "Gamma"

quant_df_laplace <- pred_q_laplace$fit
quant_df_laplace$x1 <- X_grid[quant_df_laplace$id, "x1"]
quant_df_laplace$model <- "Laplace"

bind_rows(quant_df_gamma, quant_df_laplace) %>%
  ggplot(aes(x = x1, y = estimate, color = factor(index), group = index)) +
  geom_line(linewidth = 1) +
  geom_point(size = 2) +
  facet_wrap(~ model) +
  labs(title = "Tail Quantiles vs x1 (SB)", x = "x1", y = "Quantile", color = "Probability") +
  theme_minimal()


Residuals & Diagnostics

Code
plot(fitted(fit_sb_cond_gpd_gamma))

Code
plot(fit_sb_cond_gpd_gamma, family = c("traceplot", "autocorrelation", "geweke"))

=== traceplot ===


=== autocorrelation ===


=== geweke ===

Code
plot(fit_sb_cond_gpd_laplace, family = c("density", "running", "caterpillar"))

=== density ===


=== running ===


=== caterpillar ===


Takeaways

  • Conditional stick-breaking mixtures capture covariate-dependent bulk structure while the GPD handles extremes.
  • predict() and plot() remain consistent for densities, posterior-mean quantiles, and residuals.
  • Expect threshold-selected posterior-mean tail quantiles to shift with x1 even when components is fixed.
  • Next: move into causal models starting with no-X CRP (ex09).

Workflow Navigation

  • Previous: ex07-conditional-dpmgpd-crp
  • Next: ex09-causal-no-x-crp
  • Workflow index: Roadmap
  • Practical entry: Examples

Prereqs

  • Required packages and data for this page are listed in the setup chunks above.

Outputs

  • This page renders model fits, diagnostics, and summary artifacts generated by package APIs.

Interpretation

  • Canonical concept page: Model Umbrella
  • Treat this page as an application/example view and use the canonical page for core definitions.

Next

  • Continue to the linked canonical concept page, then return for implementation-specific details.
(c) CausalMixGPD - Bayesian semiparametric modeling for heavy-tailed data
- - Cite - API - GitHub